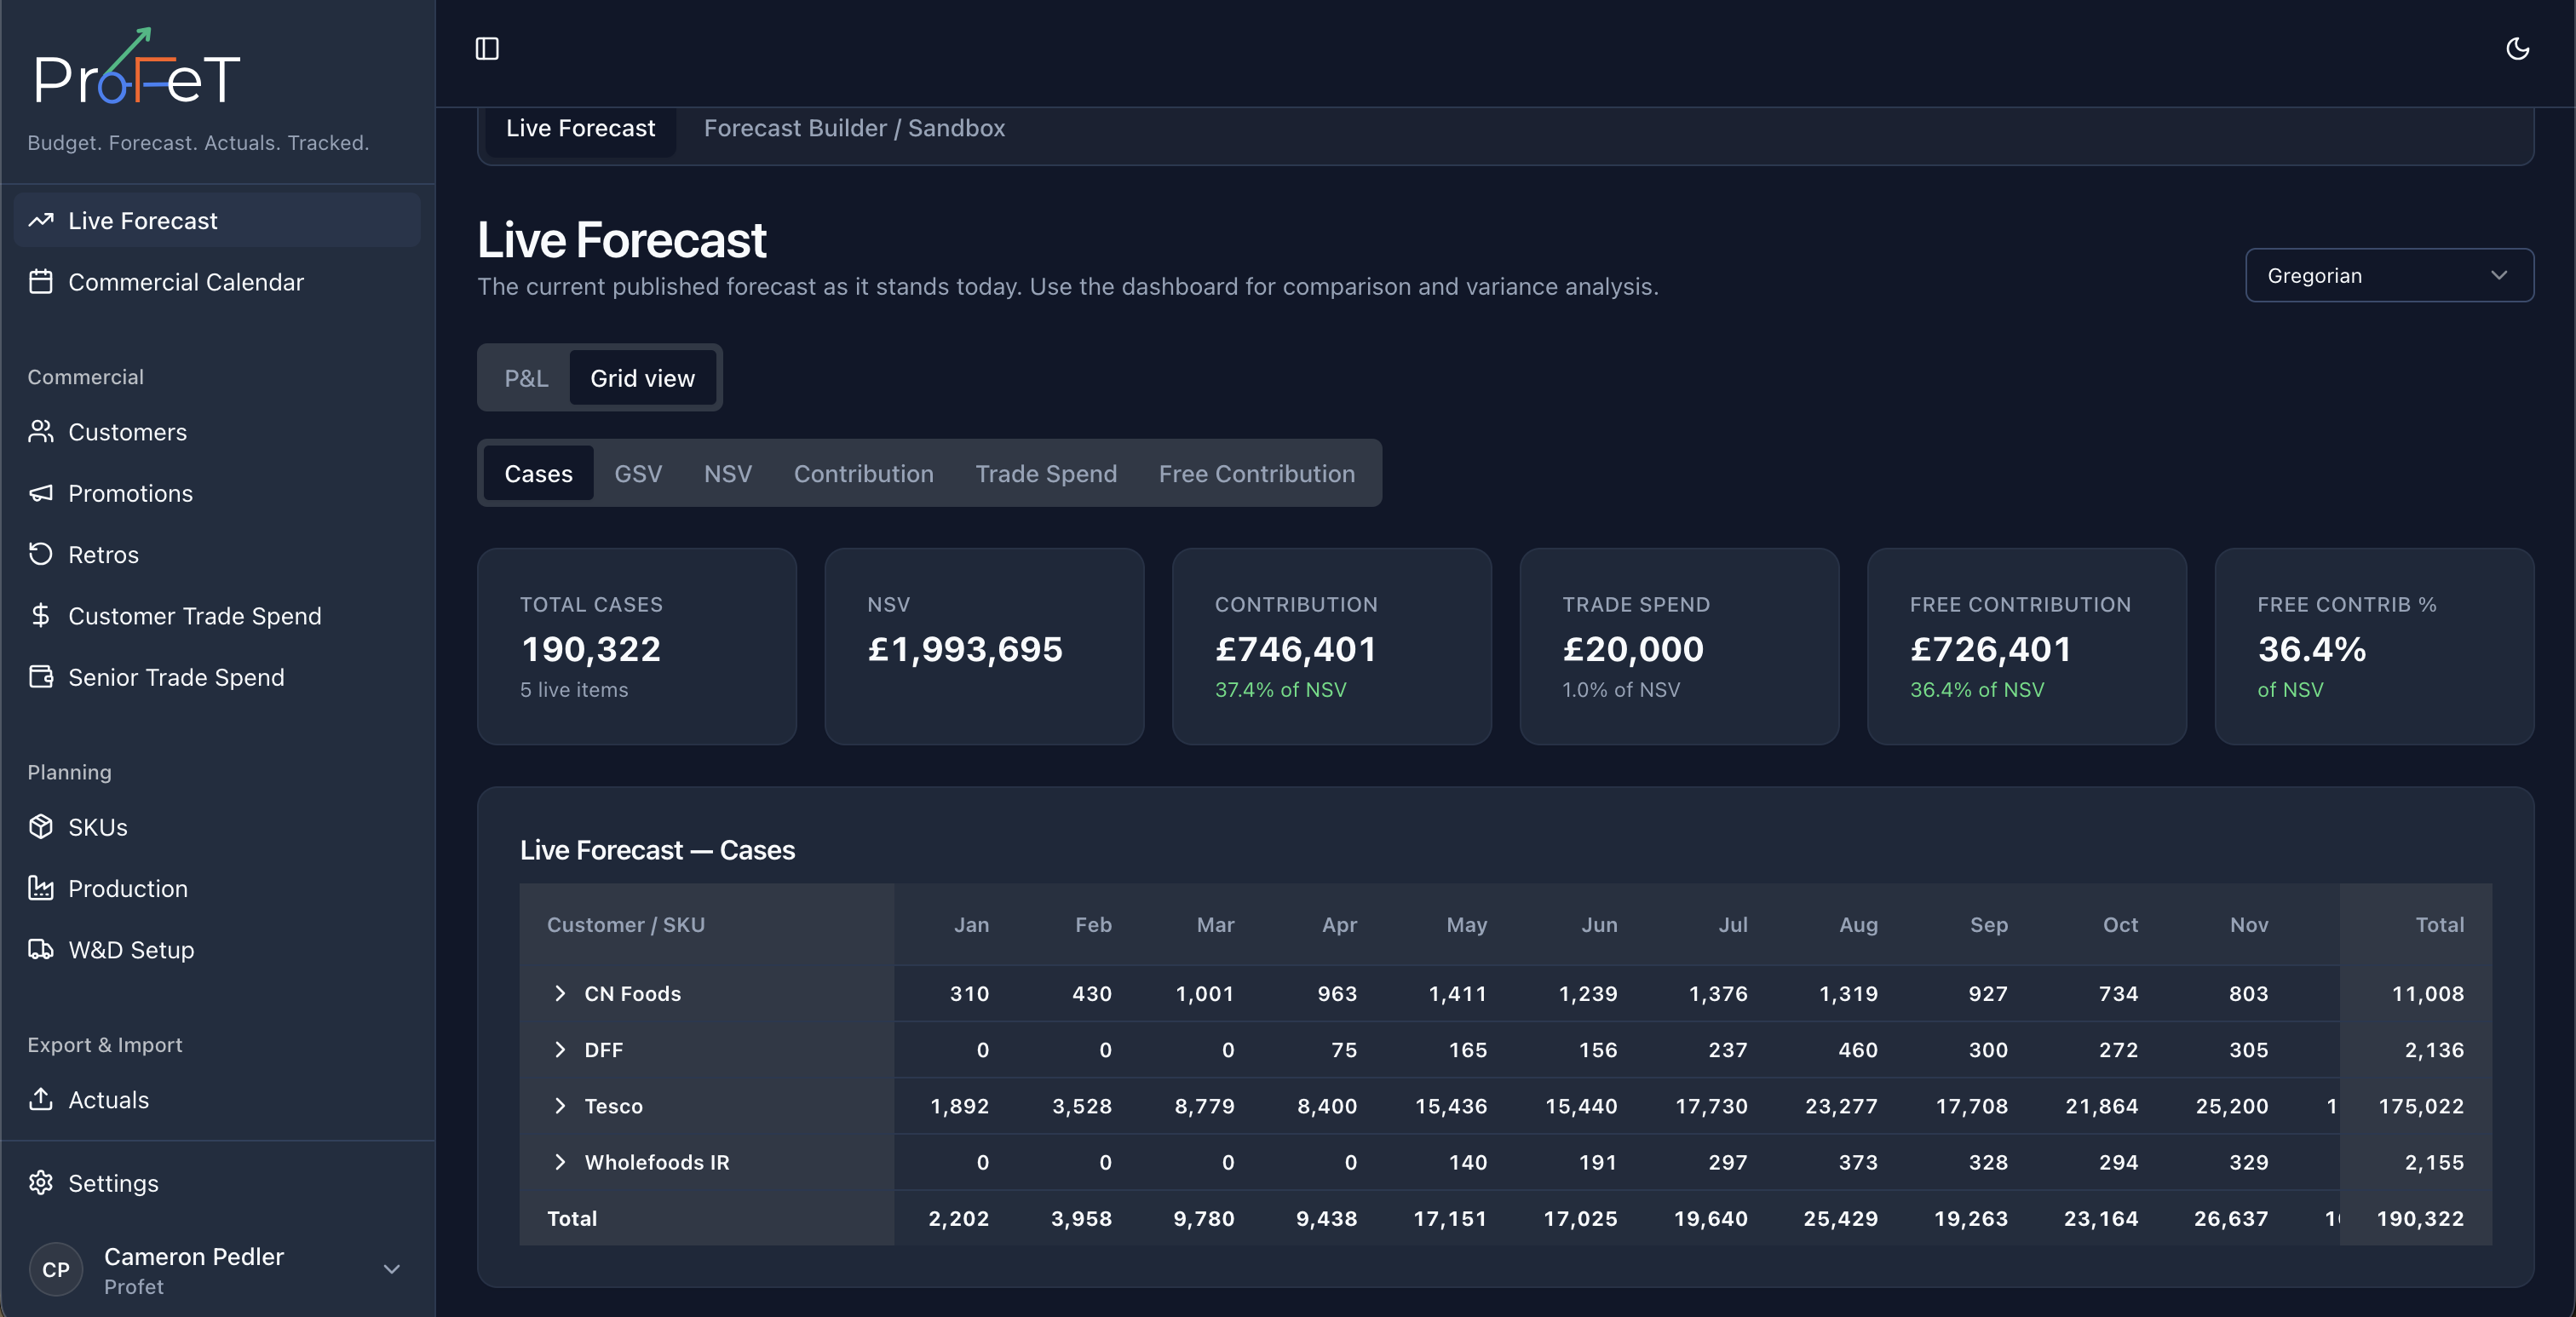
Live Forecast
View the current published forecast with P&L and customer/SKU grid analysis.
The Live Forecast page is the published forecast view. It is focused on analysis of what is currently live, not editing or approval workflow.
Use this page to analyze the overall P&L, inspect customer-level and SKU-level contribution, and switch calendar mode.
What You See
The page has two primary views:
- P&L View
- Grid View
Both views are based on currently live forecast lines.
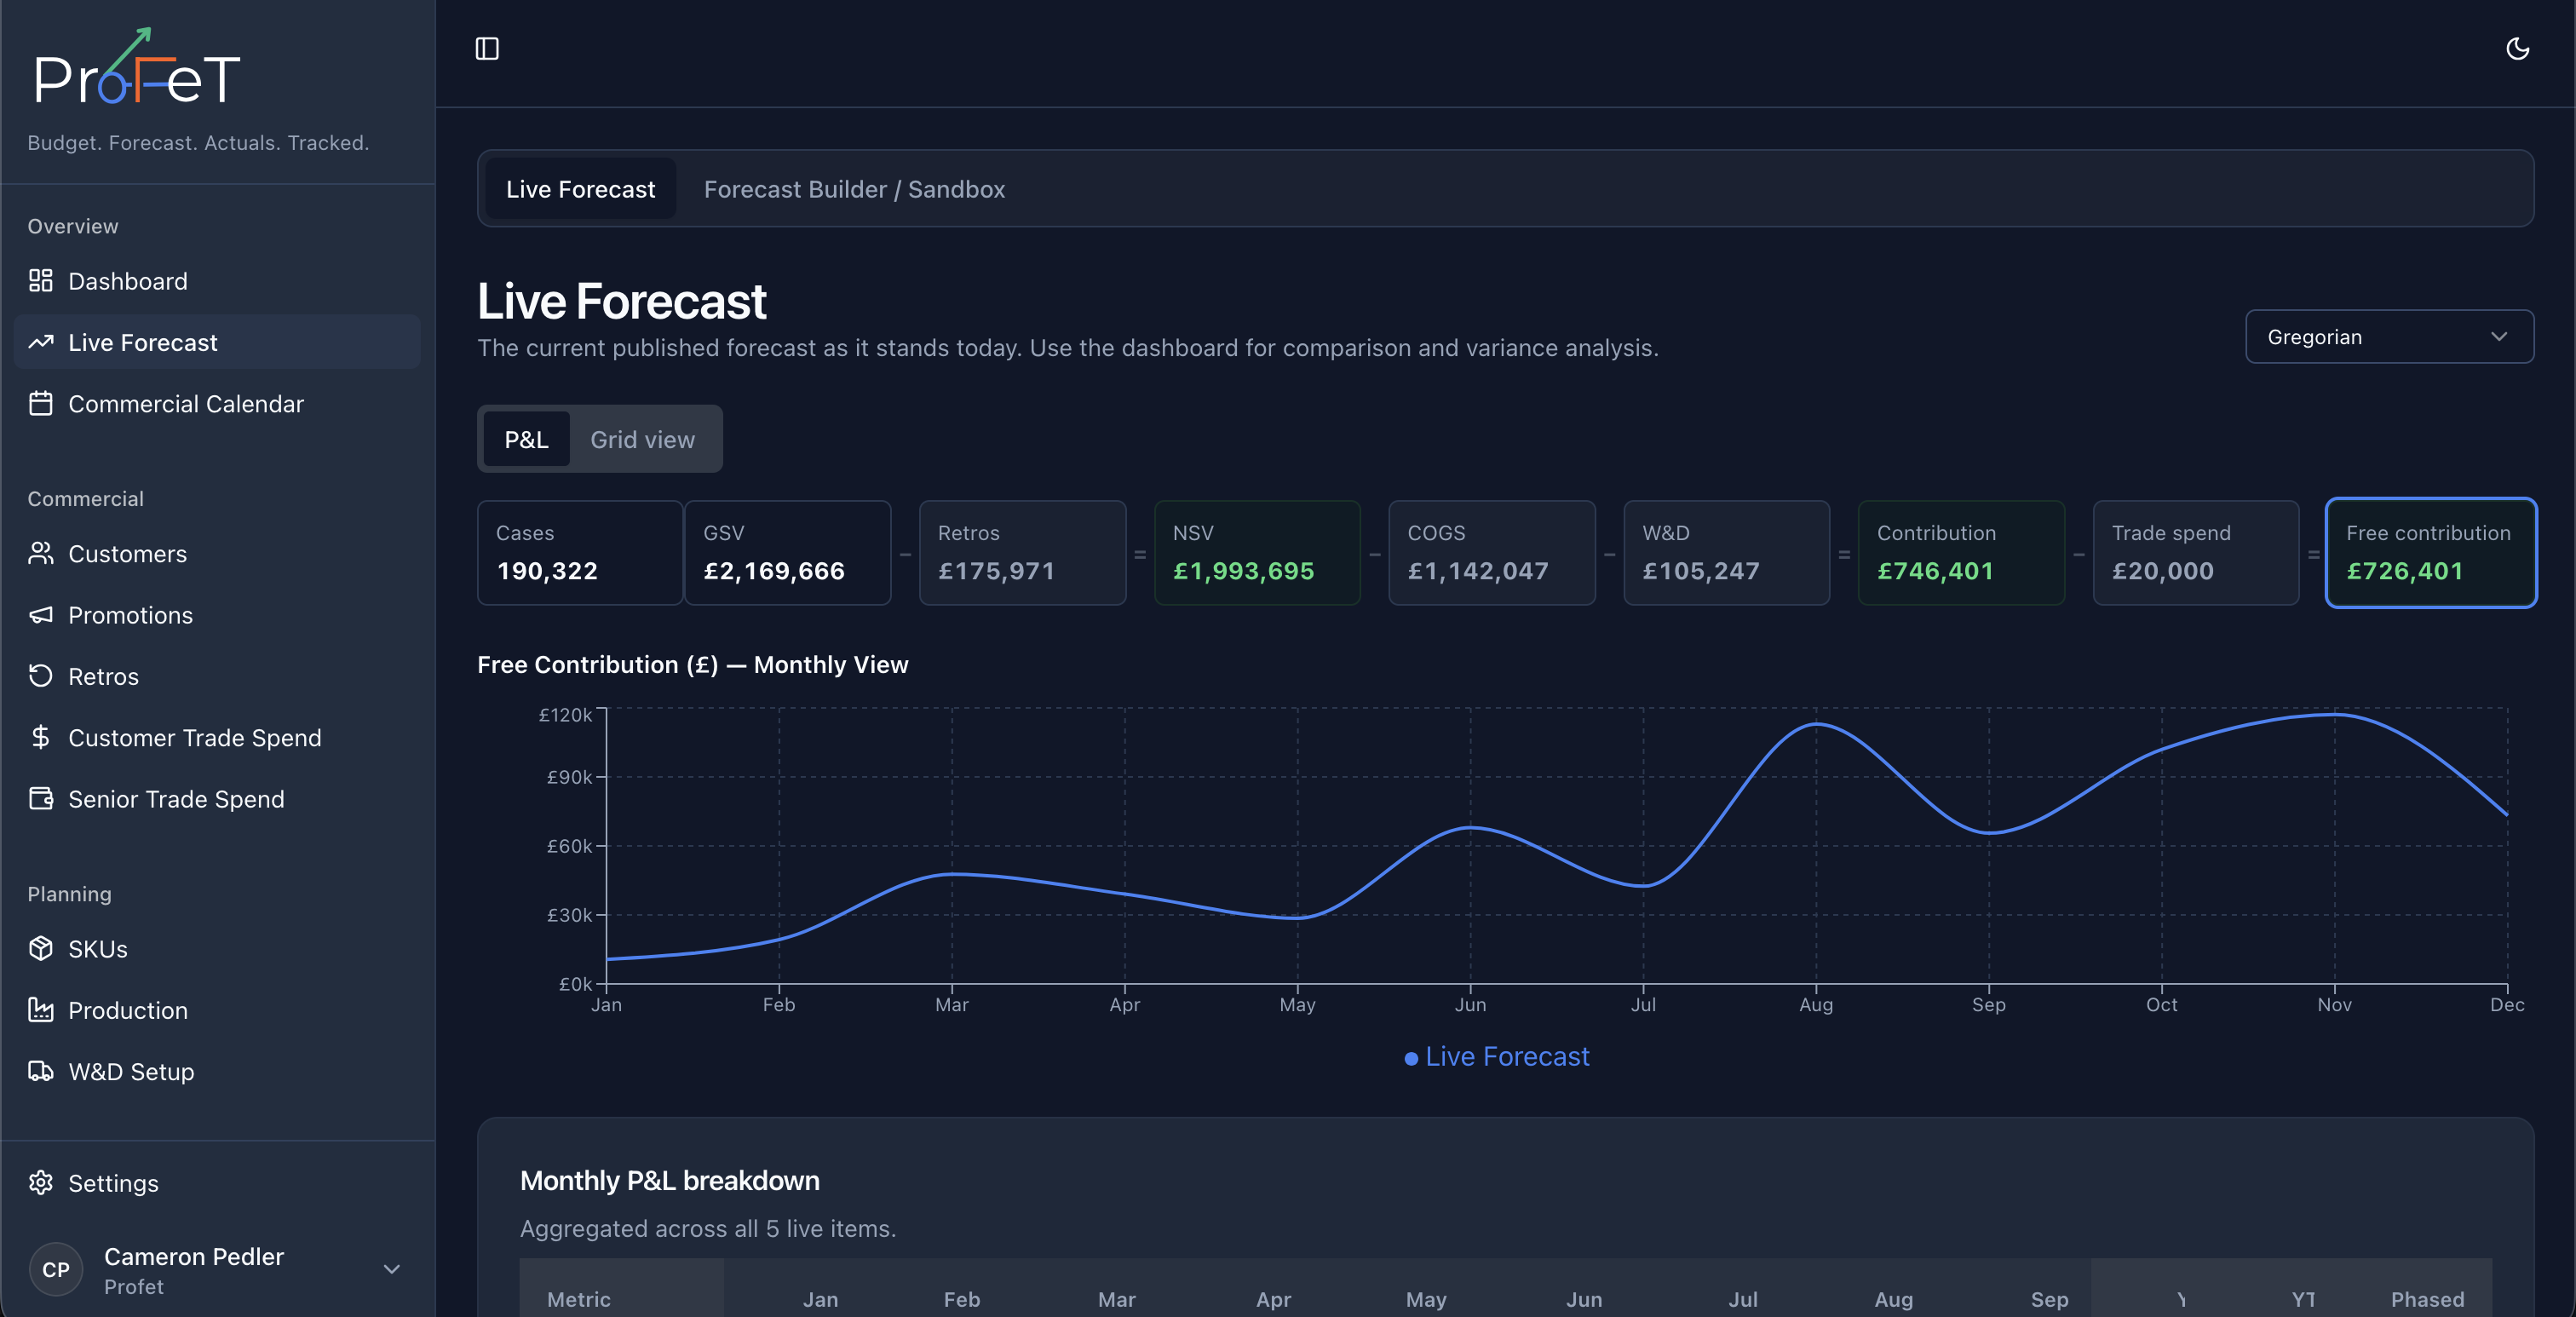
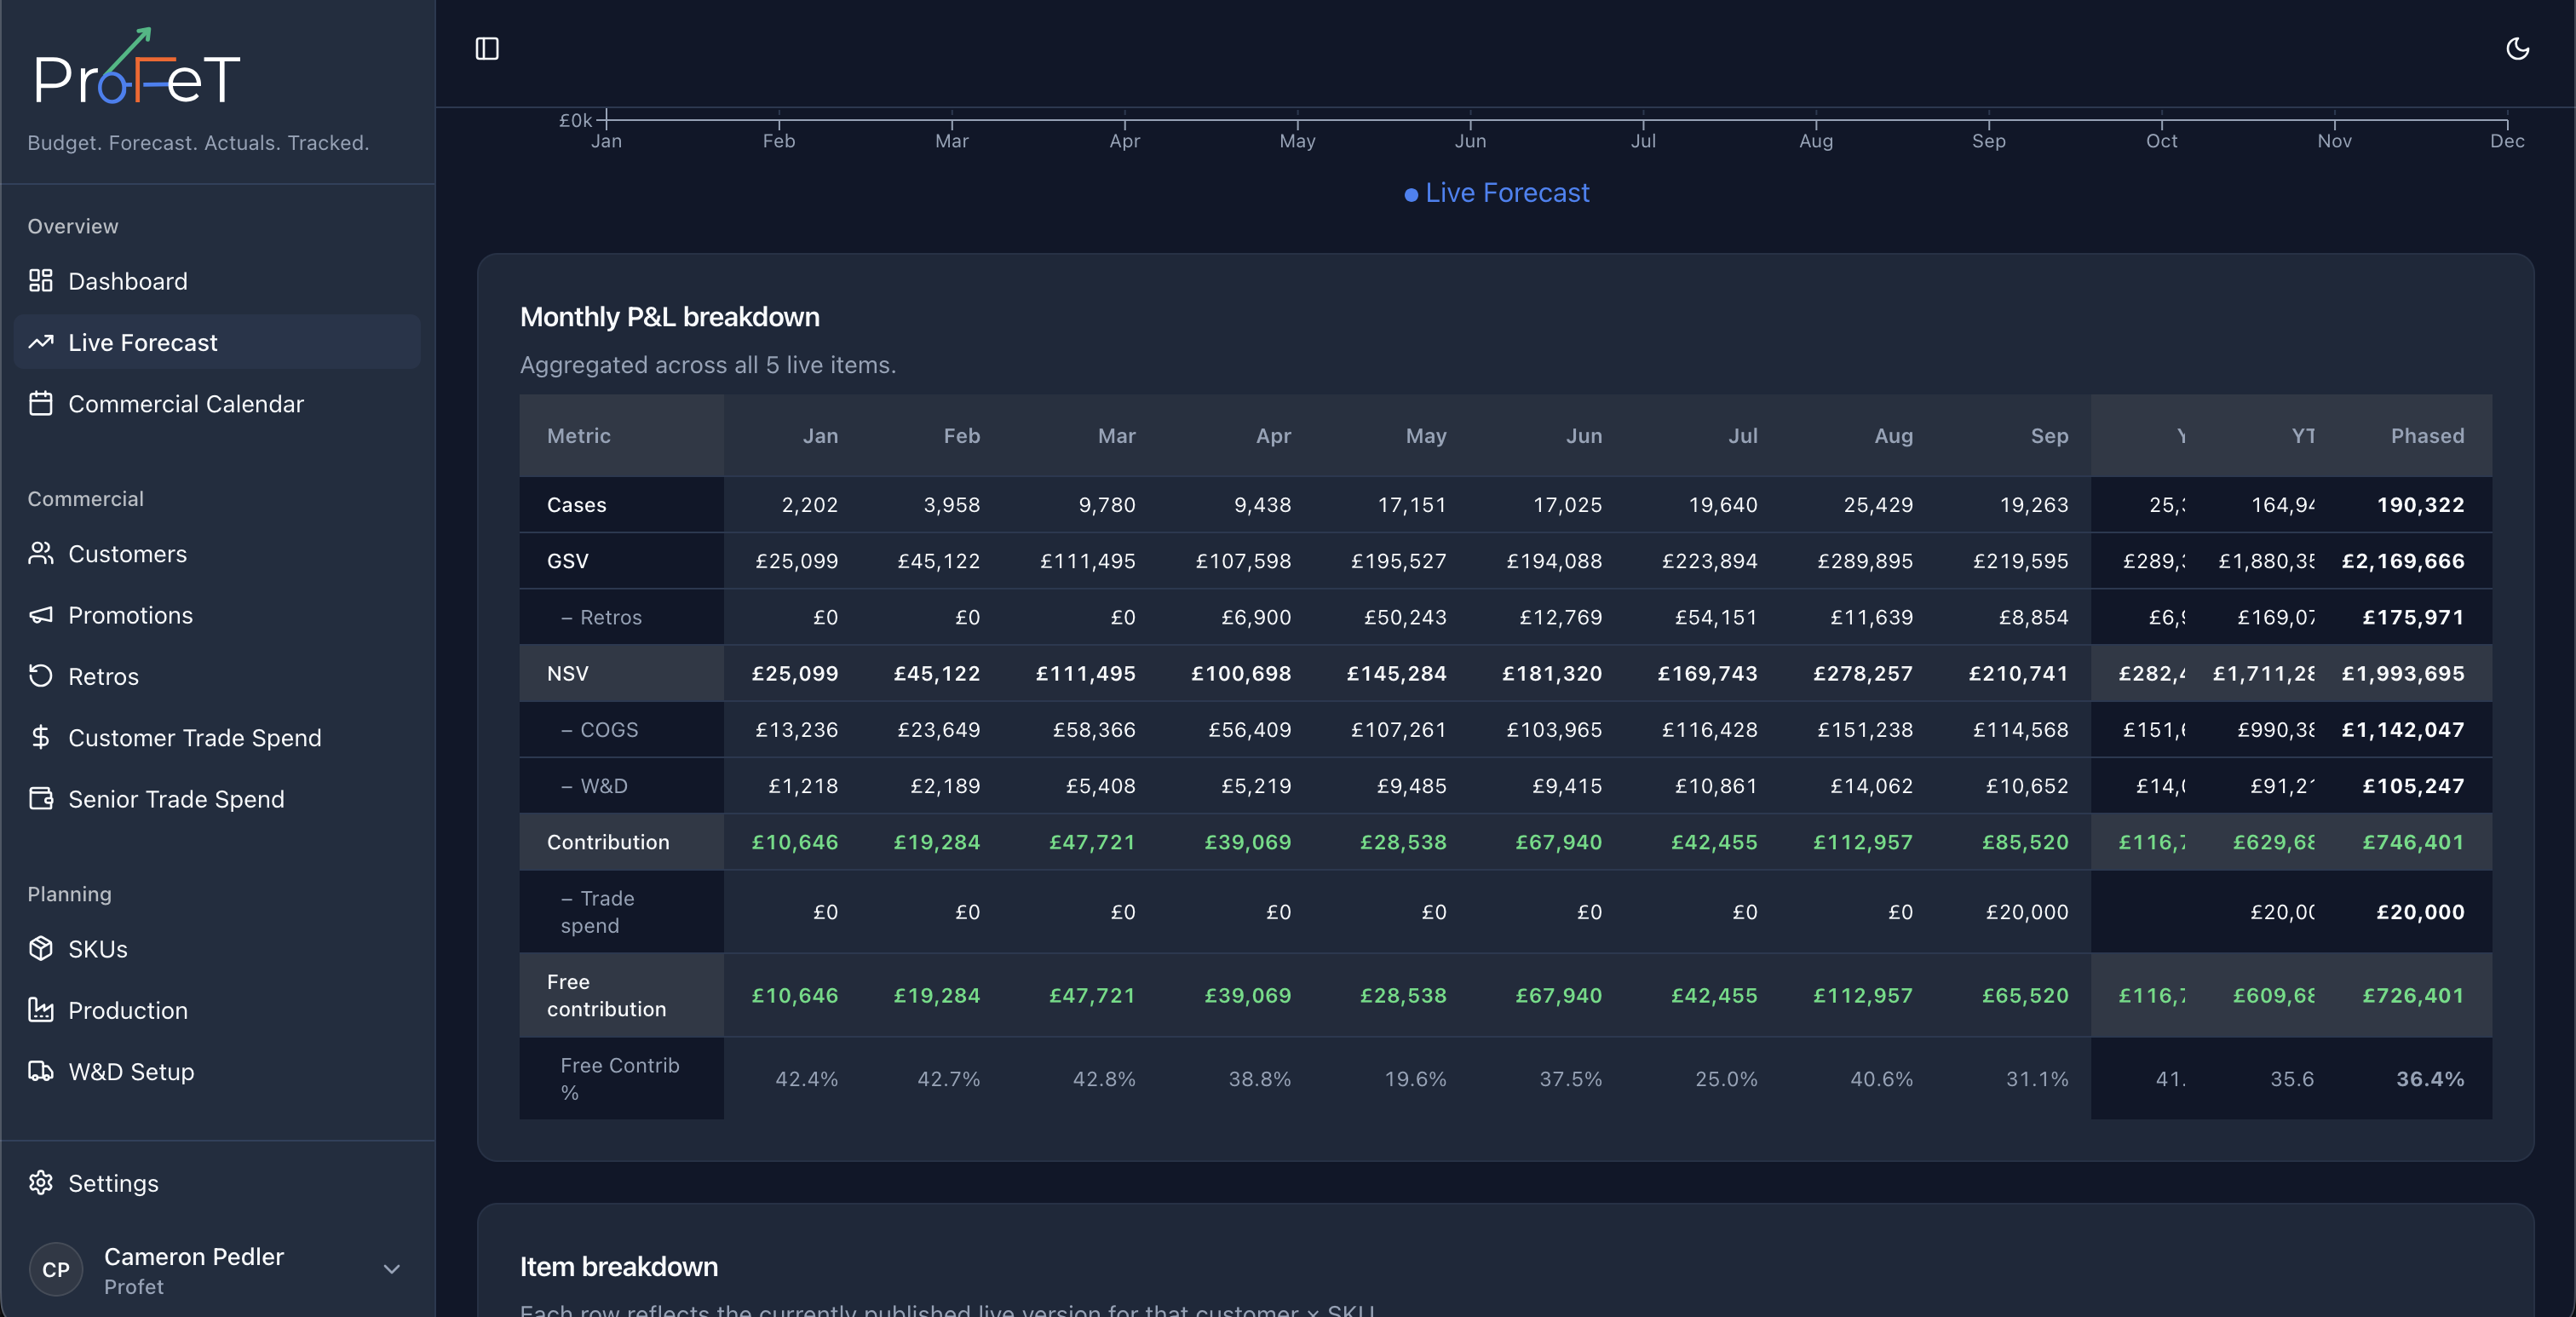
P&L View
The P&L tab includes:
- A waterfall-style KPI strip for Cases, GSV, Retros, NSV, COGS, W&D, Contribution, Trade Spend, and Free Contribution
- A selectable trend chart by metric
- Monthly table output aligned to the selected calendar type
The COGS and W&D tiles include warning states if live lines contain gaps or zero-value anomalies.
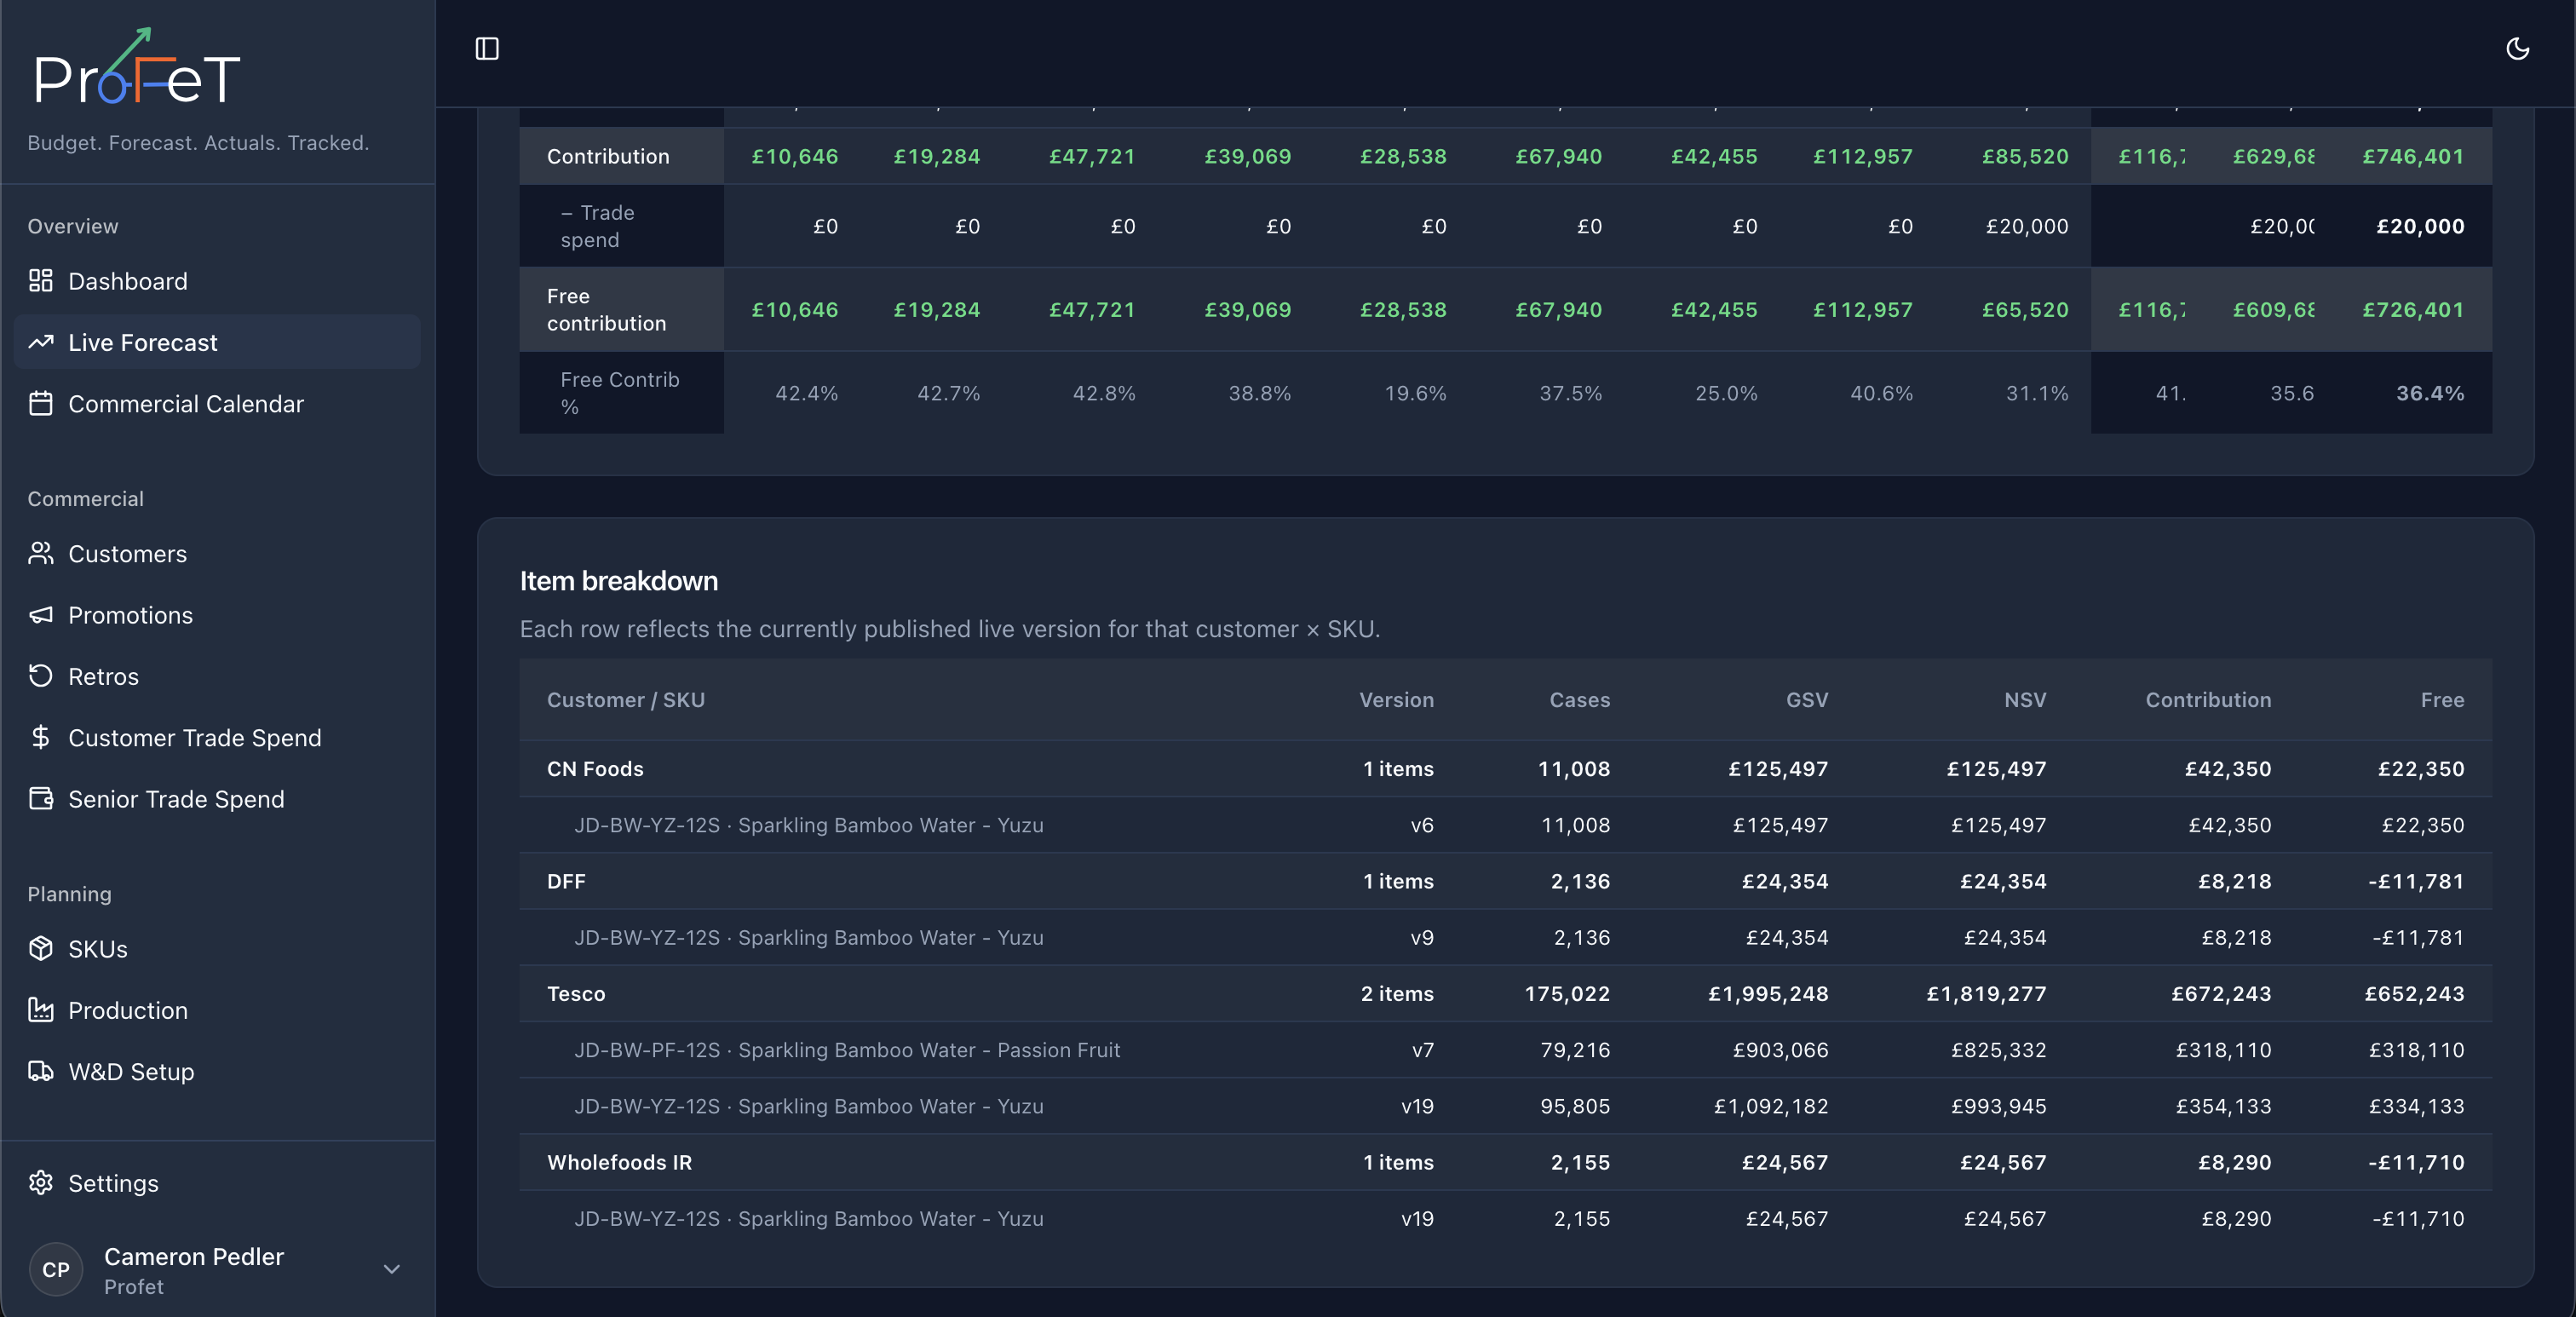
Grid View
The Grid tab groups live forecast data by customer and SKU with period-level values and totals.
Use this to answer questions like:
- Which customers drive most contribution?
- Which SKUs are underperforming by period?
- How does volume distribution change by calendar view?
Calendar Support
Live Forecast supports multiple calendar modes:
- Gregorian
- 4-4-5
- 4-5-4
- 5-4-4
Switching calendar type updates period grouping and labels in both P&L and grid views.
How Cases Are Calculated
Each forecast line starts with the volume output from the Forecast Builder — driven by market assumptions (TAM, SAM, ROS, ramp, seasonality, promotional uplift). If you’ve manually overridden any weeks in the builder, those overrides carry through.
Financial metrics are then computed:
GSV           = Cases × Price per Case
Retros        = Cases × Retro per Case
NSV           = GSV − Retros
COGS          = Cases × COGS per Case
W&D           = Cases × W&D per Case
Trade Spend   = Allocated from trade spend records
Contribution  = NSV − COGS − W&D − Trade Spend
What Live Forecast Is Not
Live Forecast does not handle approval actions, budget cut creation, or reference-set management directly.
It also does not host Review Items workflow. Review Items are handled in Forecast Review.
For review and governance workflows, use Forecast Review.
Live Forecast Screens